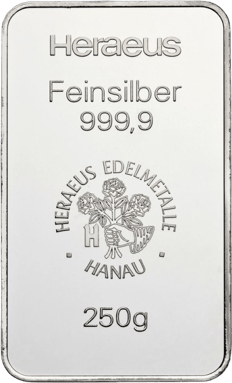
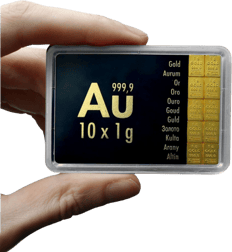
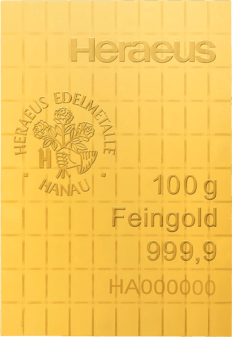
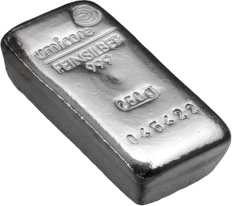
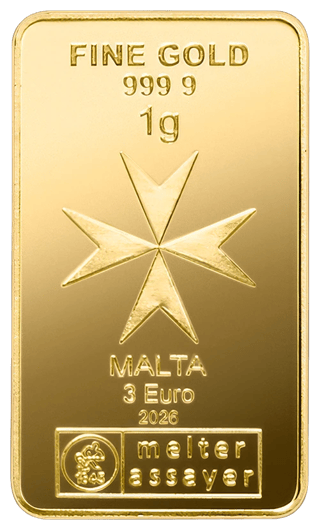
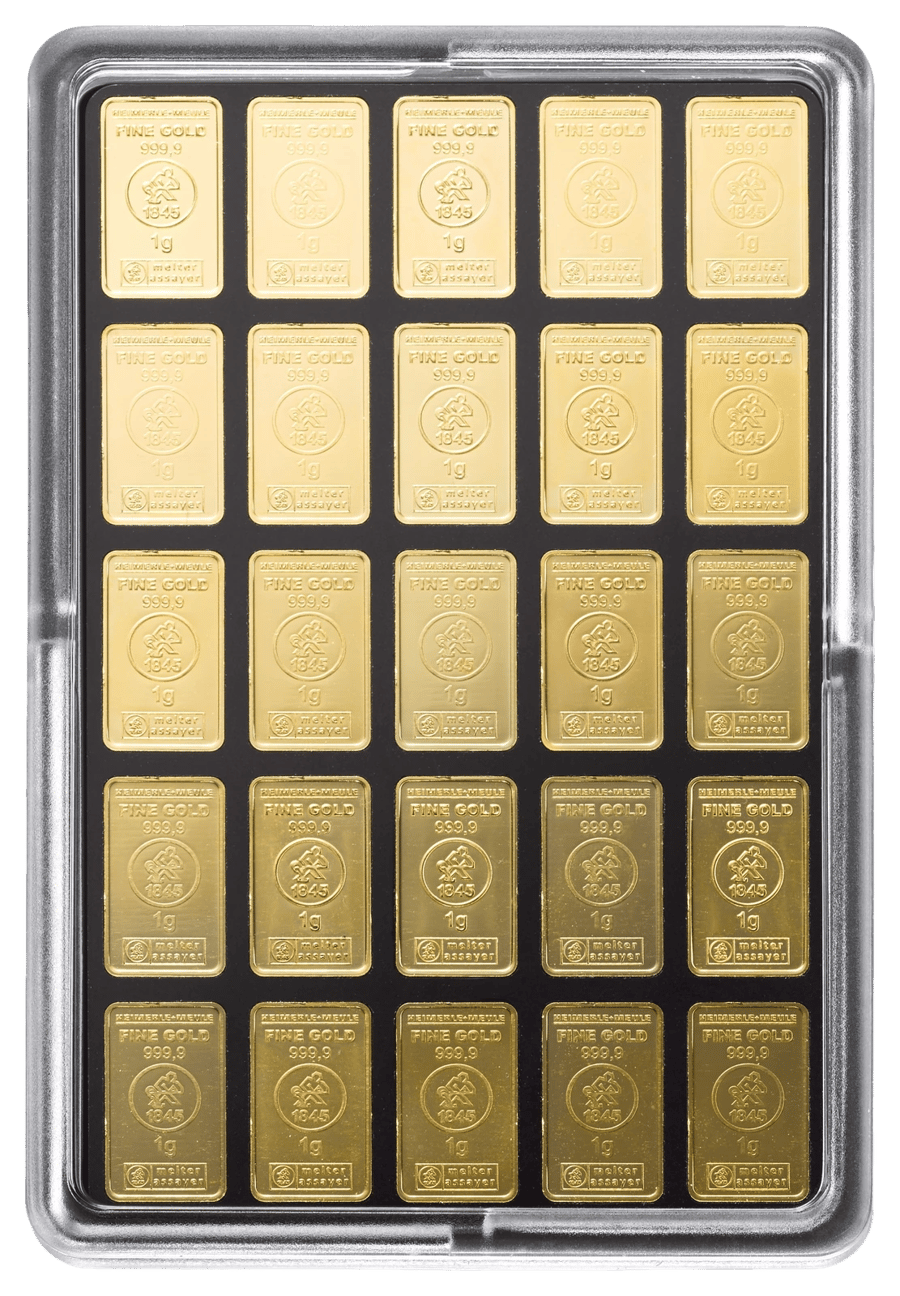
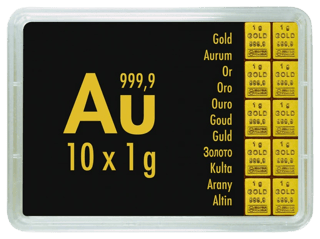
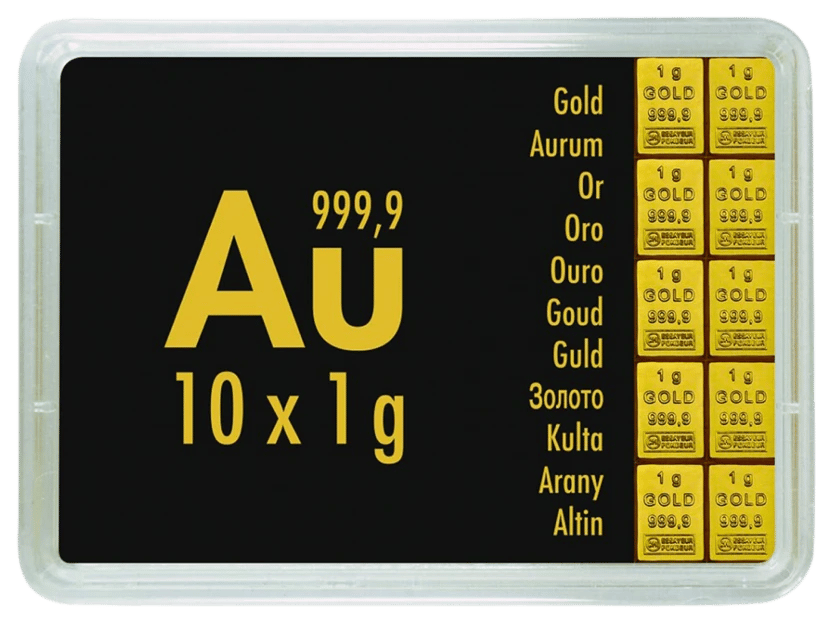
25 x 1g Gold Bar Heimerle und Meule UnityBar
£2,937.09£2,978.77
VAT-free and excl. shipping
Ships from 20/11/2026
 +49 7930-2699

 More than 300,000
 Over 30 years
 Secure shipping
 Google: 4.9/5
Every year, your money loses value. Just a few years ago, you could do a week's worth of grocery shopping for €70, and now the purchasing power of your money has declined significantly. To prevent your savings from losing further value, you should protect them by investing in value-preserving products such as gold and silver as an inflation hedge.


The Deutsche Bundesbank works out how many euros it took in 2025 to buy what 100 D‑Marks used to buy.
The Bundesbank’s table shows how many euros, on average in 2025, had the same purchasing power as one D‑Mark or one euro of an earlier year. It is based on the official price indices for the standard of living, and since 1994 on the consumer price index. Below, choose a year between 1950 and 2025.
Purchasing power asks a different question from the fixed conversion rate: what the money bought.
In 2025, what 100 D‑Marks bought in 1975 cost about
161 euros
At the fixed conversion rate: 100 D‑Marks = 51.13 euros
Calculation by the Deutsche Bundesbank, as of January 2026. The Bundesbank considers comparisons that start in the years up to 1948 to be of little informative value; the selection here starts in 1950.
How long it takes for prices to double depends on how much they rise each year.
“In the view of the ECB’s Governing Council, price stability is best maintained by aiming for an inflation rate (measured by the HICP) of 2 per cent in the euro area over the medium term.”
Why not zero? The Bundesbank cites, among other things, measurement errors in the statistics and a safety margin against deflation, that is, against falling prices.
Calculated with a rate of inflation that stays the same year after year.
Each increase builds on prices that have already risen. That is why, at 2 per cent a year, prices take not 50 years to double but 35.
Approximate: calculated from the annual averages of the price indices of the Federal Statistical Office (Destatis; up to 1991 price indices for the standard of living, then the consumer price index). The series changes in 1962/63 and 1991/92.
Between 1920 and 1975, five countries took the silver out of their circulation coins, each in its own time and often in stages.
31 March 1920Coinage Act 1920
500/1,000 silver, not 925/1,000
6 November 1946Coinage Act 1946
Cupronickel, not 500/1,000 silver
three quarters copper, a quarter nickel
23 July 1965Public Law 89‑81
Dime and quarter without silver, previously 900/1,000
Half dollar: 4.6 g silver in 11.5 g, calculated as 40 per cent
1968Swissmint
Cupronickel, not 835/1,000 silver
½ to 5 francs; the five‑franc coin of 1969 once again in silver
1 April 1971Swissmint
Silver coins demonetised
extended to 31 March 1972
15 January 1969BGBl. Nr. 439/1968
5 schillings in cupronickel instead of 640/1,000 silver
4.8 g instead of 5.2 g
17 April 1974BGBl. Nr. 174/1974
10 schillings: cupronickel with a pure nickel core, not 640/1,000 silver
6.2 g instead of 7.5 g
1 February 1975Deutsche Bundesbank
5 D‑Marks in Magnimat instead of 625/1,000 silver
10.00 g instead of 11.20 g; the silver coin no longer in circulation since 1 August 1975
Diameters to the same scale
Diameters as given by the Deutsche Bundesbank and the Oesterreichische Nationalbank.
The sources name no common cause. In Great Britain, it paid for a short time in 1920 to melt down the coins, as the Chancellor of the Exchequer recalled in 1946. In Switzerland, the silver value of the ½, 1 and 2‑franc coins exceeded their face value, and the coins were melted down, Swissmint writes.
For 1946, the Chancellor of the Exchequer gave other reasons. For the USA, President Johnson cited the shortage of silver in 1965; for Germany, the Bundesbank cites the sharp rise in the price of silver. For Austria, the catalogue of the Oesterreichische Nationalbank gives no reason.
Under Augustus, the Roman denarius was practically pure silver. The last antoniniani under Gallienus contained less than 5 per cent.
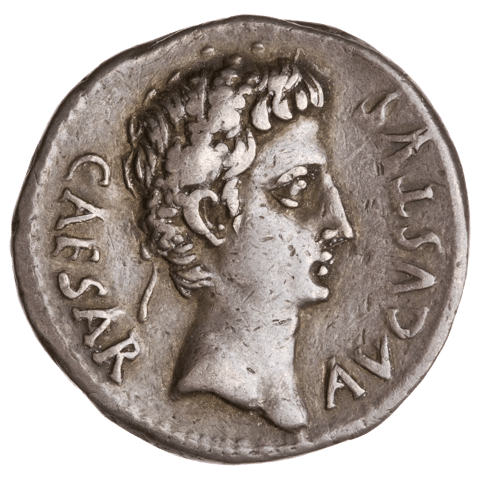
c. 99 per cent
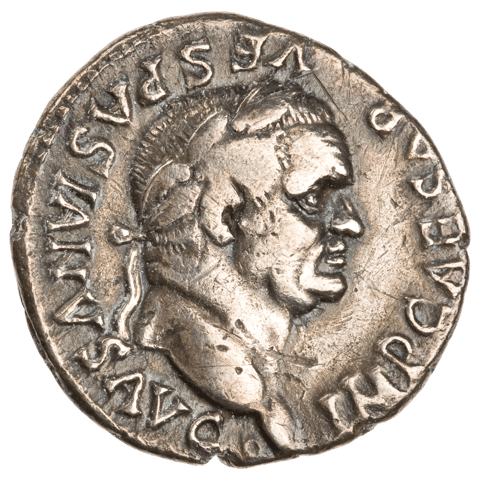
c. 80 to 90 per cent
82 briefly pure silver
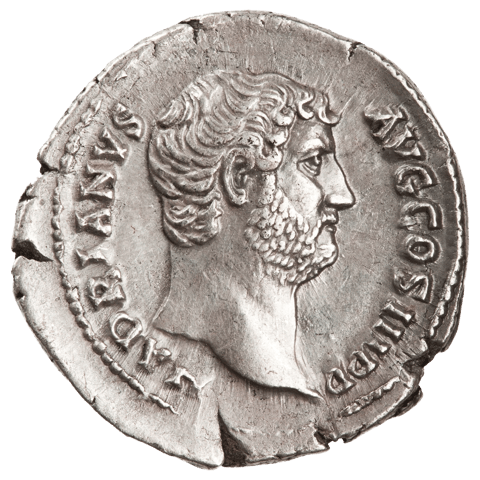
c. 76 to 90 per cent
under Trajan, c. 100, about 80 again
under Hadrian, about 76 on average
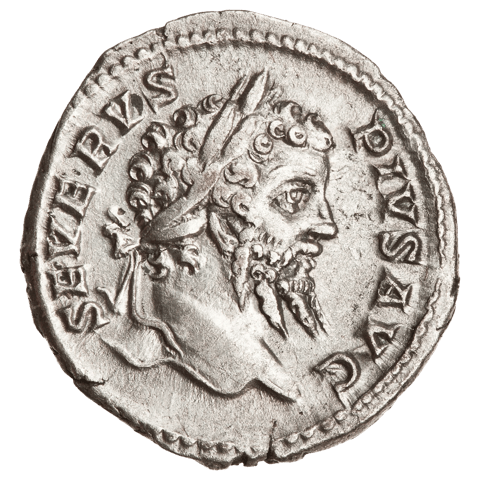
from c. 75 to below 50 per cent
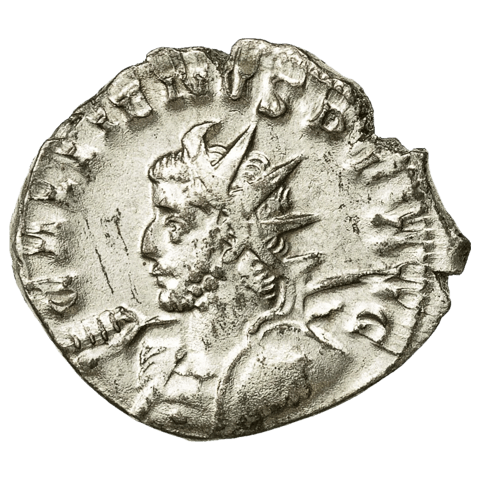
until c. 250, c. 40 to 50 per cent
in the last issues under Gallienus below 5 per cent
The figures come from analyses of the metal inside the coins, mostly from drilled samples; surface measurements read too high. For the denarii, they apply to the mints of Rome and Lyon. Even the coins of a single emperor vary by more than ten percentage points, which is why ranges are shown here. The photos each show one example from the period of the stage.
The path did not run straight downhill. In 64, Nero lowered the silver content to about 80 per cent, and around 68 he raised it again to about 90. In 82, Domitian briefly had pure silver struck again. Butcher and Ponting read it like this: the emperors raised the content again whenever they could.
The antoninianus was added in 214/215 under Caracalla and was worth two denarii.

About 222,600 tonnes of gold had been mined by mid‑2026, as estimated by the World Gold Council. That is about 60 years’ worth of mine production.
Measured against the production of 2025: in that year, 3,672 tonnes came from the world’s mines. Almost all the gold ever mined still exists.
So each year adds about 1.5 to 1.6 per cent: production in 2025 divided by the stock, our own calculation with the 3,672 tonnes of the World Gold Council and the estimated 3,300 tonnes of the U.S. Geological Survey.
Stay informed with product launches, financial news and exclusive offers. Sign up for our free newsletter today.
By entering your email address and clicking the "Submit" button, you give the following consent: "I agree to be informed by email about new products, financial news and exclusive offers, and therefore consent to the processing of my email address for the purpose of sending the newsletter. I can revoke this consent at any time without giving reasons, with effect for the future. The lawfulness of processing carried out prior to revocation remains unaffected."